








Tracksino has expanded its analytics platform with the introduction of two dedicated statistics trackers for Monopoly Big Baller and Ice Fishing. The infrastructure update introduces separate analytics pages and dashboards for each game, expanding the platform’s capabilities with game-specific tracking tools designed around their individual mechanics, bonus systems and statistical requirements.
The new trackers are designed to collect, organize, and visualize historical game data in real time. Rather than focusing only on individual rounds, they provide aggregated statistics that help users examine long-term game behavior, bonus frequency, and multiplier distribution across large samples.
The new Tracksino dashboards provide access to statistics for the past 24 hours and available round history. Depending on the game, these include total rounds, biggest wins, bonus activity, multiplier data, “since last” values, temperature indicators and detailed result histories.
The two new trackers provide different types of insights depending on the game mechanics:
| Tracker | Data Available | Purpose |
|---|---|---|
| Monopoly Big Baller Statistics Tracker | Total rounds, Since Last 3 Rolls, Since Last 5 Rolls, biggest wins, dice-roll tiers, doubles, dice totals and round history | Helps analyze bonus activity, dice-result distribution and recorded payouts |
| Ice Fishing Statistics Tracker | Temperature and “since” values for Leaf 1, Leaf 2, Lil’ Blues, Big Oranges and Huge Reds; biggest wins; and round history with Result, Multiplier, Bonus Multiplier, Total Winners and Total Payout | Helps compare the historical occurrence of result categories, multipliers and recorded payouts |

These additions expand Tracksino’s existing infrastructure while maintaining a consistent analytics framework across multiple Evolution game shows.
Why Modern Evolution Game Shows Need Better Statistics
Recent Evolution titles are considerably more complex than traditional roulette or blackjack. Modern game shows combine multiple game mechanics, layered bonus systems, random multipliers and interactive features within a single session.
Because of this complexity, reviewing only recent results provides limited insight into overall game behavior. Large datasets allow players, researchers, and industry observers to better understand how frequently different events occur over thousands of completed rounds.
Several statistical indicators are particularly useful when analyzing these games:
- Bonus frequency – measures how often bonus rounds or special features are triggered across large samples;
- Multiplier distribution – shows how frequently different multiplier values appear throughout historical gameplay;
- Volatility indicators – illustrate how widely outcomes vary over time;
- Result distribution – compares standard outcomes with premium events;
- Long-term RTP observations – help evaluate how observed results compare with theoretical expectations over extended periods.
Statistical tracking also helps identify normal mathematical fluctuations and possible anomalies within large datasets. Short-term sequences may appear unusual because of variance, while larger samples provide a clearer picture of expected game behavior.
None of these metrics predicts future outcomes. Instead, they provide historical context for understanding how complex live casino games operate statistically.
Monopoly Big Baller Statistics Tracker
Monopoly Big Baller is Evolution’s live bingo-style game show inspired by the classic MONOPOLY board game. Players can bet on Free Space or Chance cards containing numbers from 1 to 60, with up to 20 balls drawn in a round. Completing lines on the cards awards payouts, and completing a full card with an active 3 Rolls or 5 Rolls bet provides access to the MONOPOLY Bonus Game, where MR. MONOPOLY moves around the board to collect additional prizes and multipliers.
Because the game combines bingo mechanics, multiple multiplier types and a separate Bonus Game, analyzing performance requires more than recording individual results. Historical data helps show how frequently the 3 Rolls and 5 Rolls bonuses occur and how dice outcomes and payouts are distributed within the recorded sample.
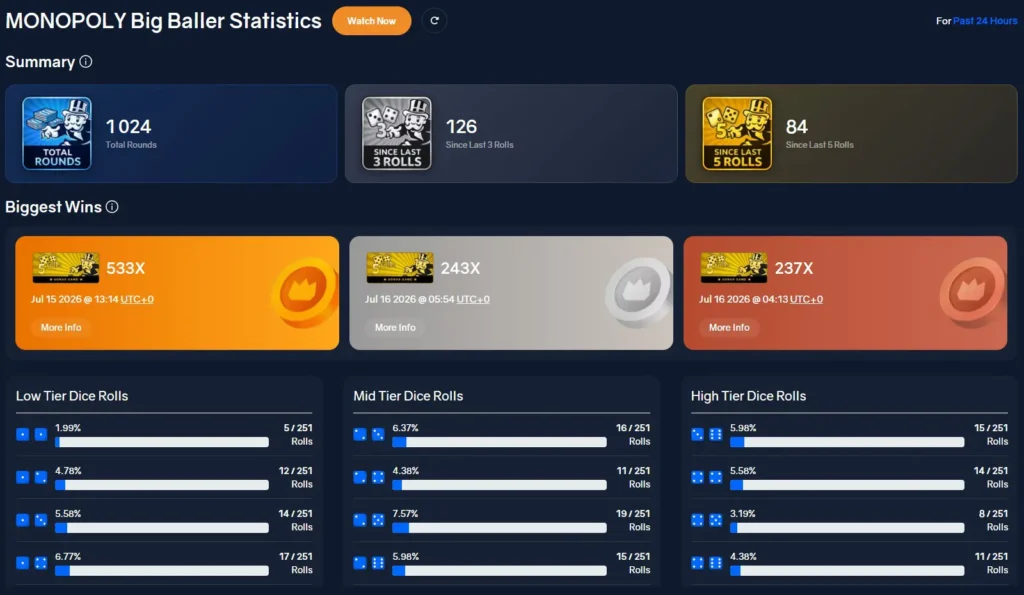
The new tracker organizes several important metrics, including:
- Total rounds recorded during the past 24 hours;
- “Since Last 3 Rolls” and “Since Last 5 Rolls” counters;
- Biggest recorded wins for the displayed period;
- Low-, mid- and high-tier dice-roll distributions;
- The number and percentage of doubles rolled;
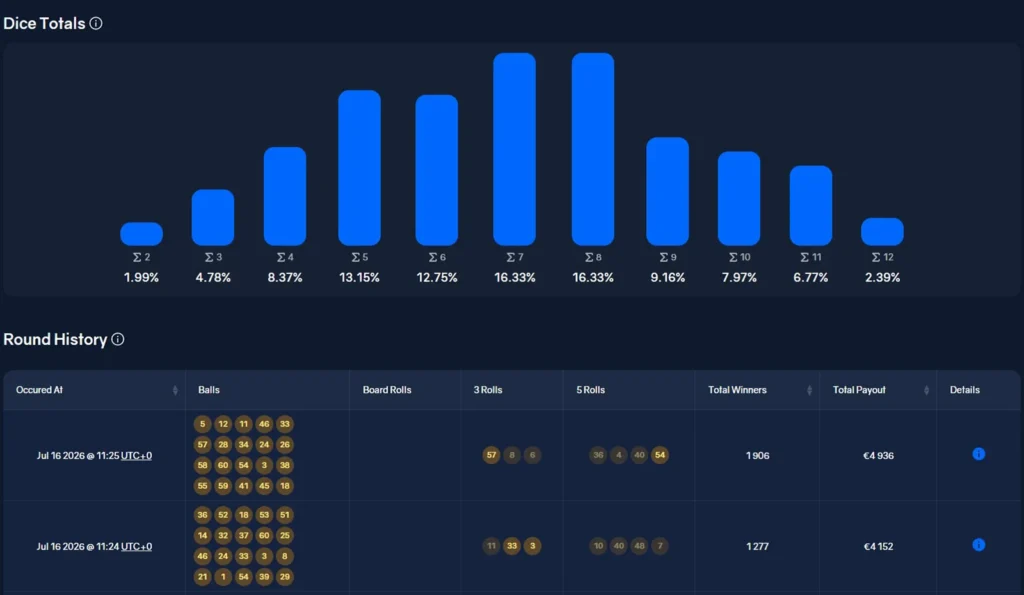
- Combined dice-total distribution from 2 to 12;
- Round History showing Balls, Board Rolls, 3 Rolls, 5 Rolls, Total Winners and Total Payout.
Instead of displaying isolated rounds, the tracker combines a 24-hour summary with recent round-level records. This allows users to compare individual outcomes with the available aggregated data while maintaining an objective view of the game’s mathematical behavior.
The dashboard is intended as an analytical resource rather than a predictive tool. Its purpose is to improve transparency by presenting historical data in an accessible format, helping users study long-term game behavior, bonus activity and dice-result distribution without implying that previous outcomes influence future rounds.
Ice Fishing Statistics Tracker
Ice Fishing is an Evolution live game show built around a 56-segment wheel and fishing-themed bonus rounds. In the tracker, results are grouped into Leaf 1, Leaf 2, Lil’ Blues, Big Oranges and Huge Reds. Because the game uses randomized mechanics, every completed round is independent and previous outcomes do not affect future results.
Since prize values and multiplier results can vary significantly between rounds, historical analysis can provide useful insight into long-term reward distribution and volatility.
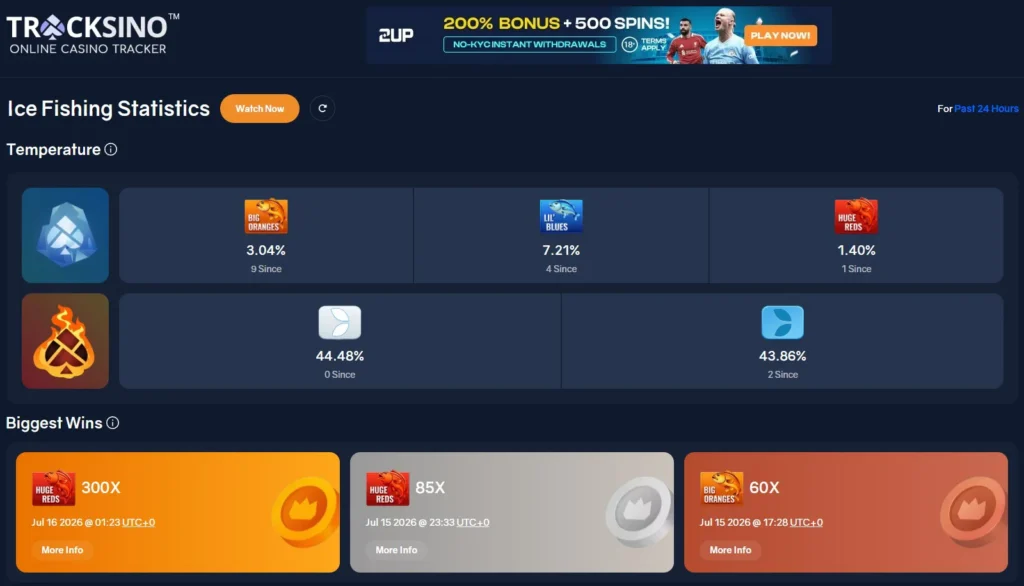
The new tracker records information such as:
- Biggest wins for the displayed period, including the result, multiplier and time;
- “Since” counters for Leaf 1, Leaf 2, Lil’ Blues, Big Oranges and Huge Reds;
- Temperature percentages indicating how often each of the five tracked results occurred during the displayed period;
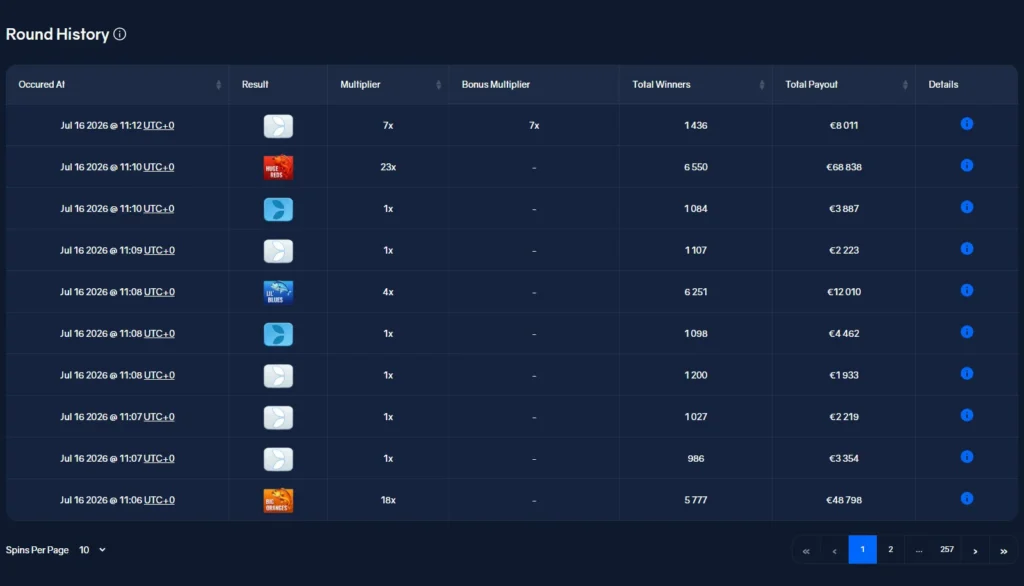
- Round History showing Result, Multiplier, Bonus Multiplier, Total Winners and Total Payout.
These datasets help visualize how different result categories and multipliers appear within the available history without suggesting that previous rounds influence future results.
The tracker updates automatically as additional game data becomes available.
Why RTP Tracking Matters
Return to Player (RTP) is one of the most commonly discussed concepts in casino mathematics, yet it is often misunderstood.
Theoretical RTP represents the average percentage of wagered money expected to be returned over an extremely large number of rounds. Individual sessions rarely match that figure because variance naturally causes short-term fluctuations.
Tracking RTP-related data can help users:
- Understand long-term variance by showing how results differ from expected averages across different sample sizes;
- Observe normal statistical fluctuation and identify changes caused by random variation;
- Compare volatility between different games by examining how frequently and widely outcomes vary;
- Analyze multiplier distribution over extended datasets;
- Better understand how theoretical RTP functions in practice by comparing mathematical expectations with historical observations.
Large samples help reduce statistical noise and provide more reliable context for evaluating game behavior. However, observed RTP over recent rounds should never be interpreted as evidence that future outcomes are more or less likely to occur.
Responsible Gambling Reminder
Statistical trackers are educational tools designed to analyze historical information. They do not predict future rounds, identify guaranteed winning patterns or increase the probability of success.
Every game round remains independent and is determined according to the game’s certified random mechanics. Players should use statistical data to better understand volatility, probability and long-term game behavior – not as a strategy for forecasting future results.
Maintaining realistic expectations, setting spending limits, and viewing live casino games primarily as entertainment remain essential principles of responsible gambling.








Comments
ive been waiting for this for so looong
This action can't be undone.